Social Report n.2
The use of Facebook in the 2019 European elections campaign
The "Social Report n.2" has been based upon data gathered from 04/28/2019 to 05/25/2019.
Chart n° 1 - Accounts, posts and engagement
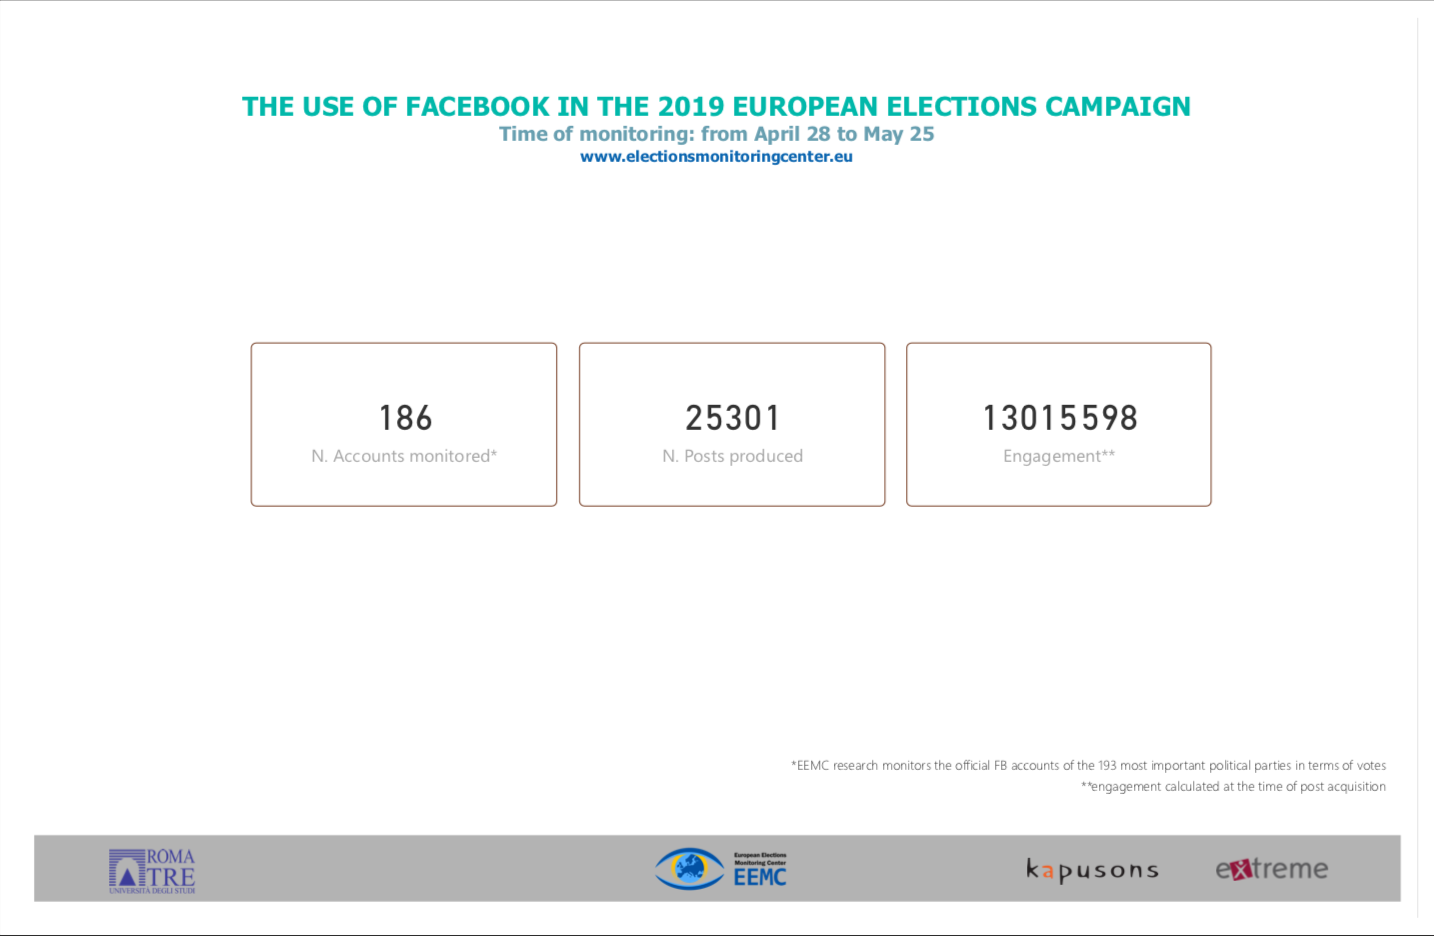
Chart n°2 - Data by geographical areas
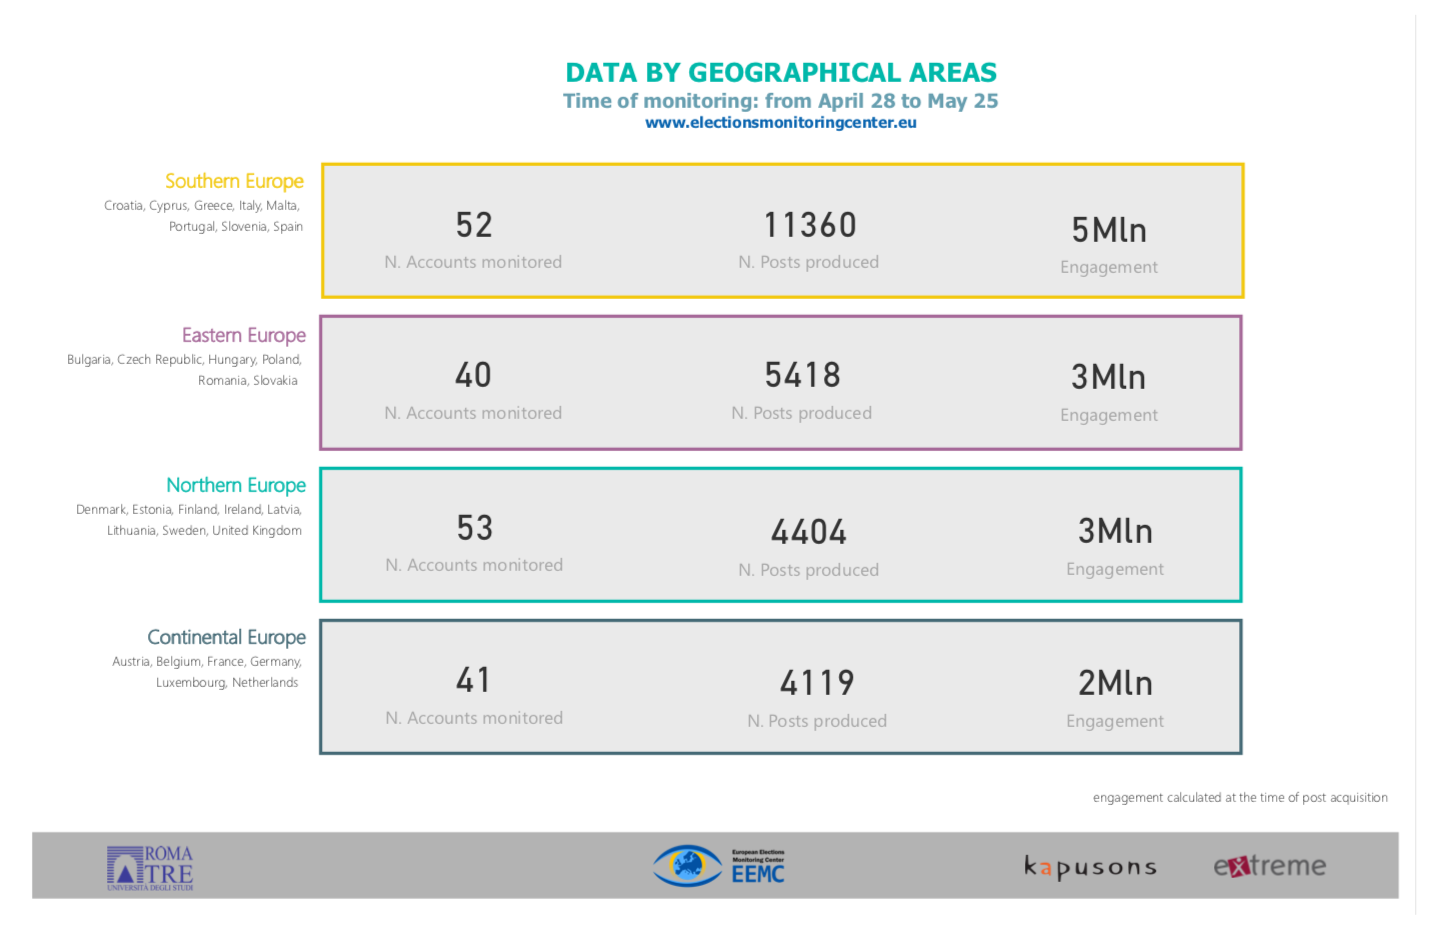
Chart n° 1 - Accounts, posts and engagement
Chart n°2 - Data by geographical areas
Chart n°3 - Number of posts by country
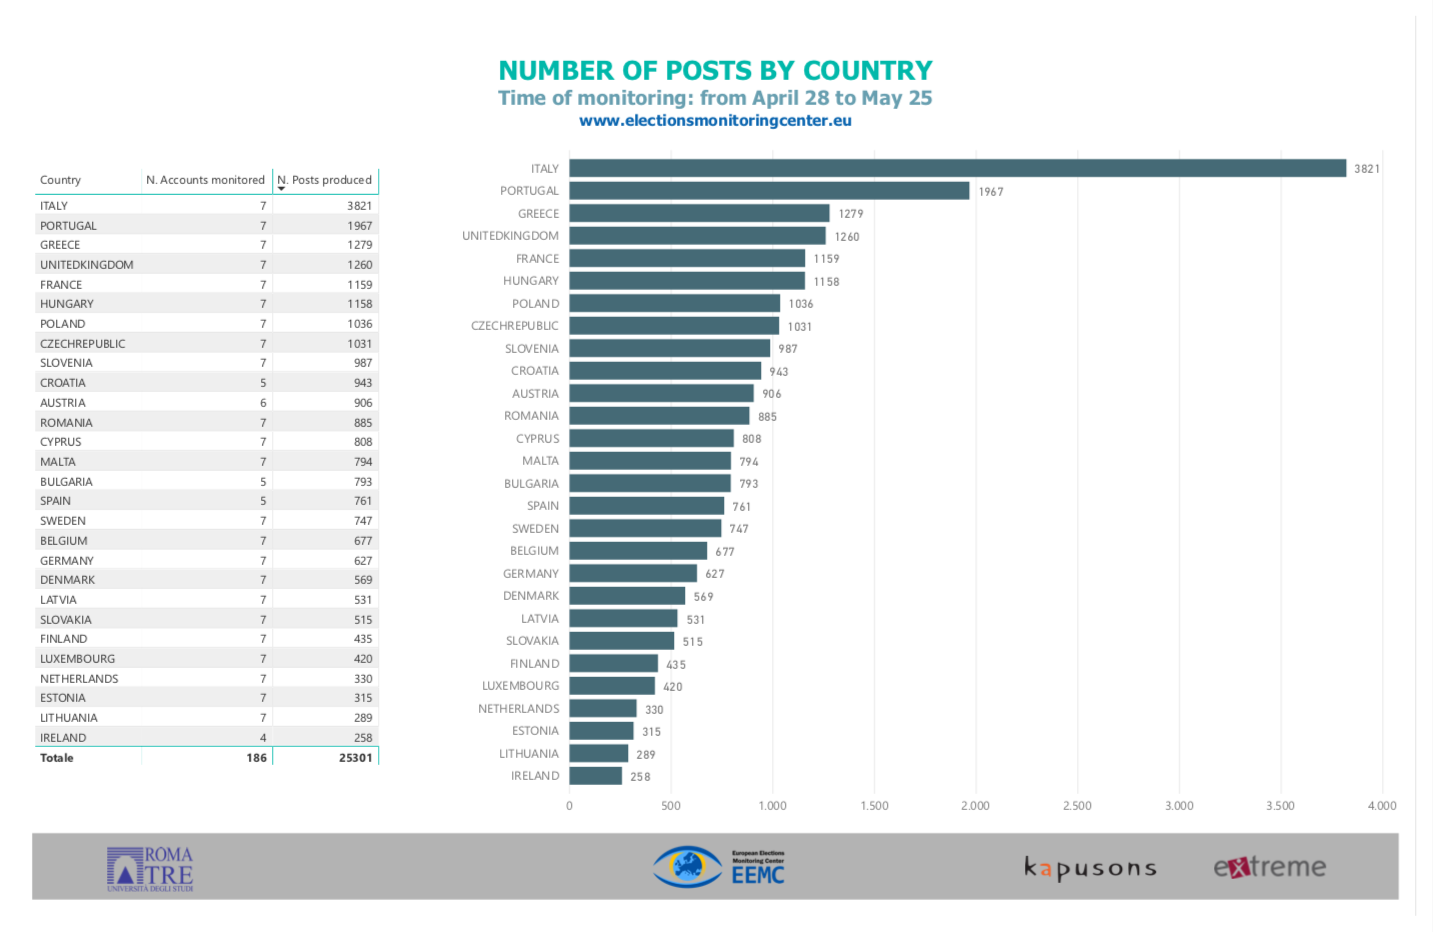
Chart n°4 - Engagement generated by country
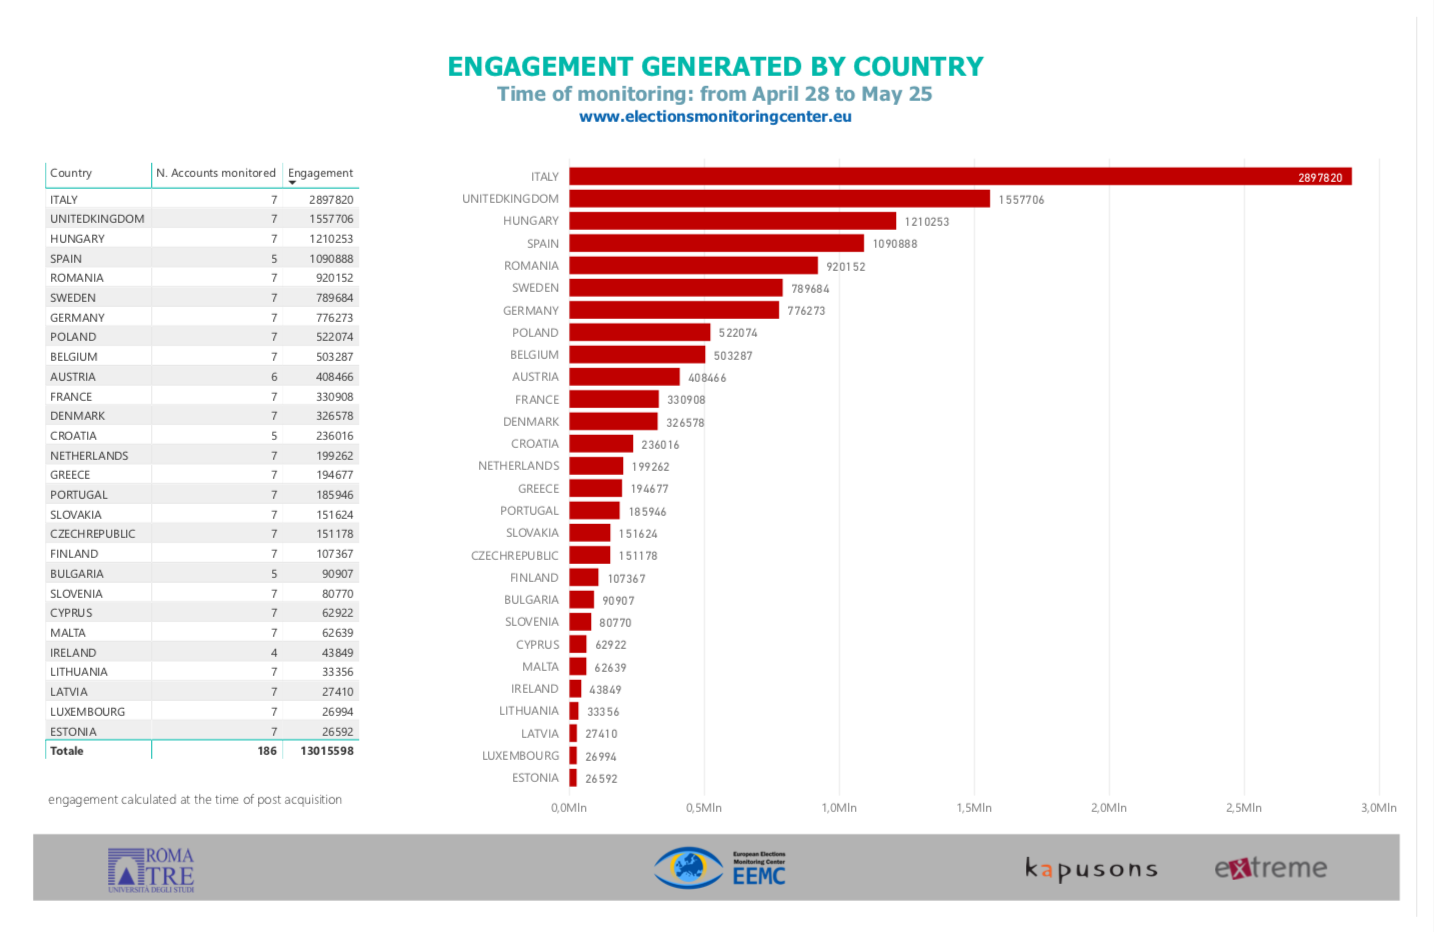
Chart n°5 - Facebook users' mood: favorable, angry, ironic/amused, sad or surprised?
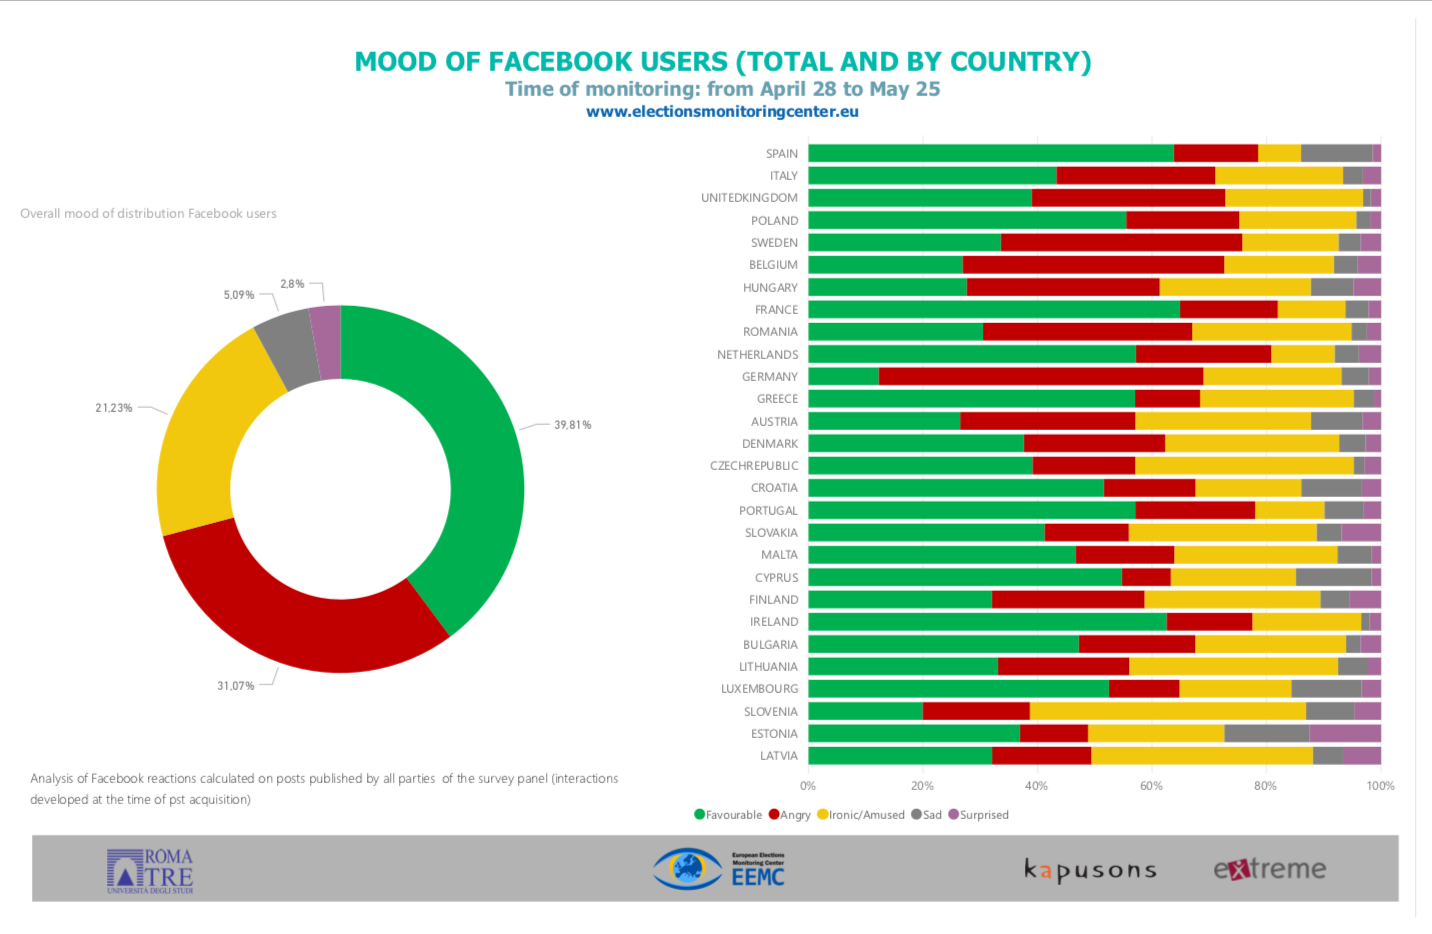
Chart n°6 - Top 20 EU parties by post production
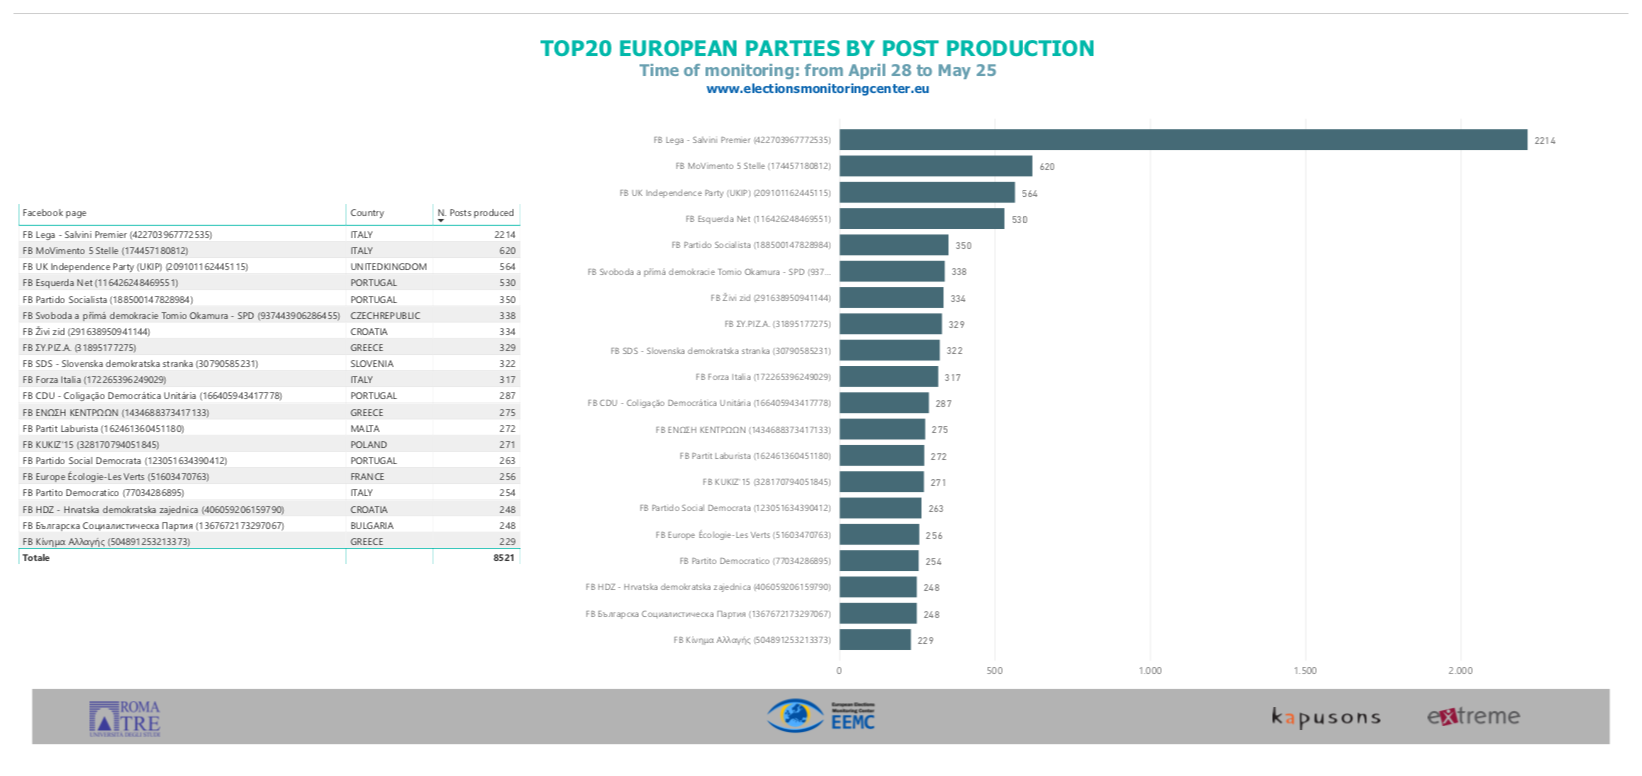
Chart n°7 - Top 20 EU parties by generated engagement
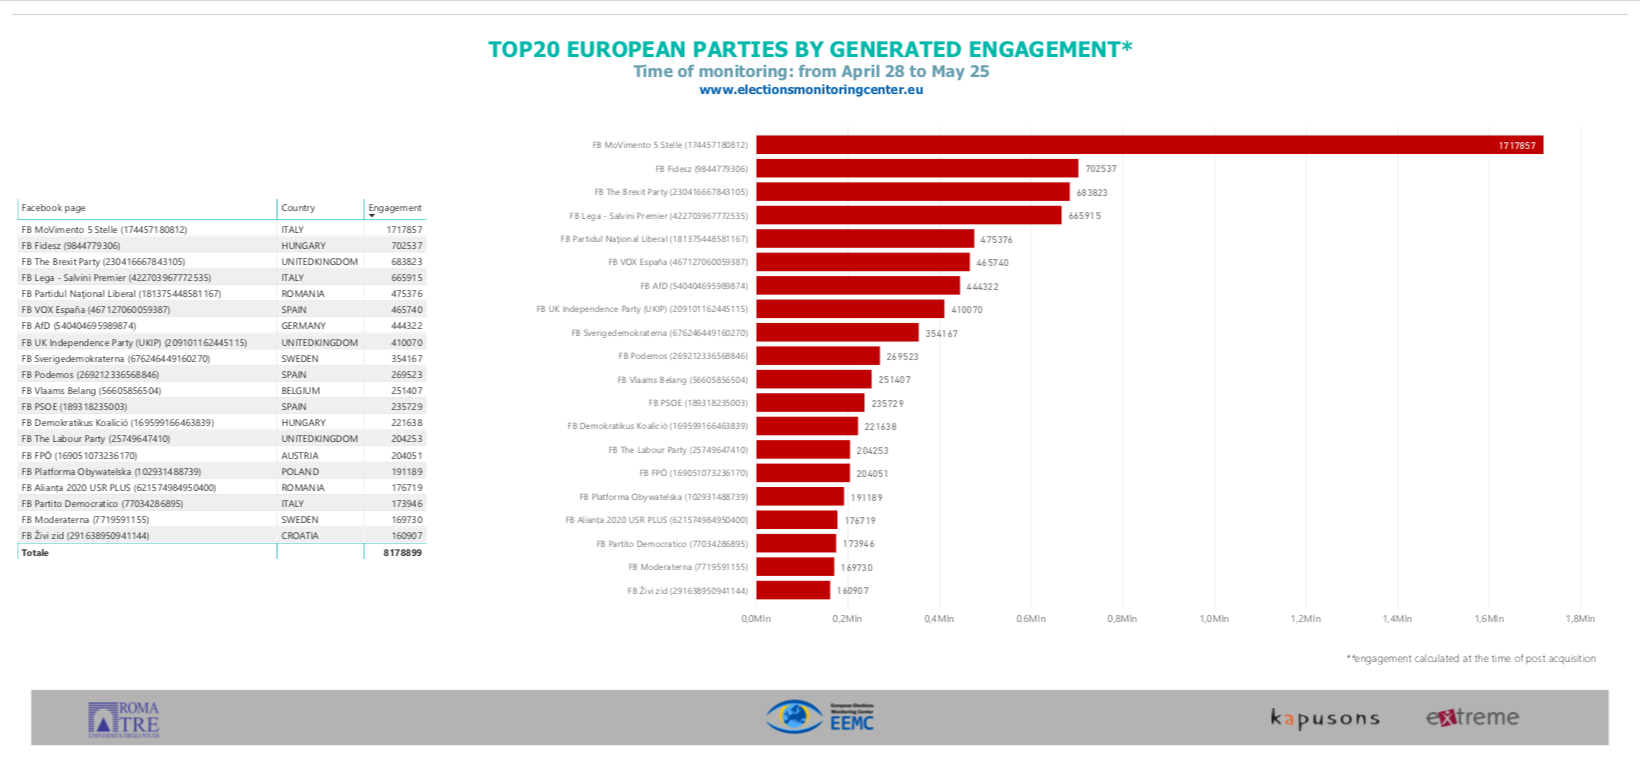
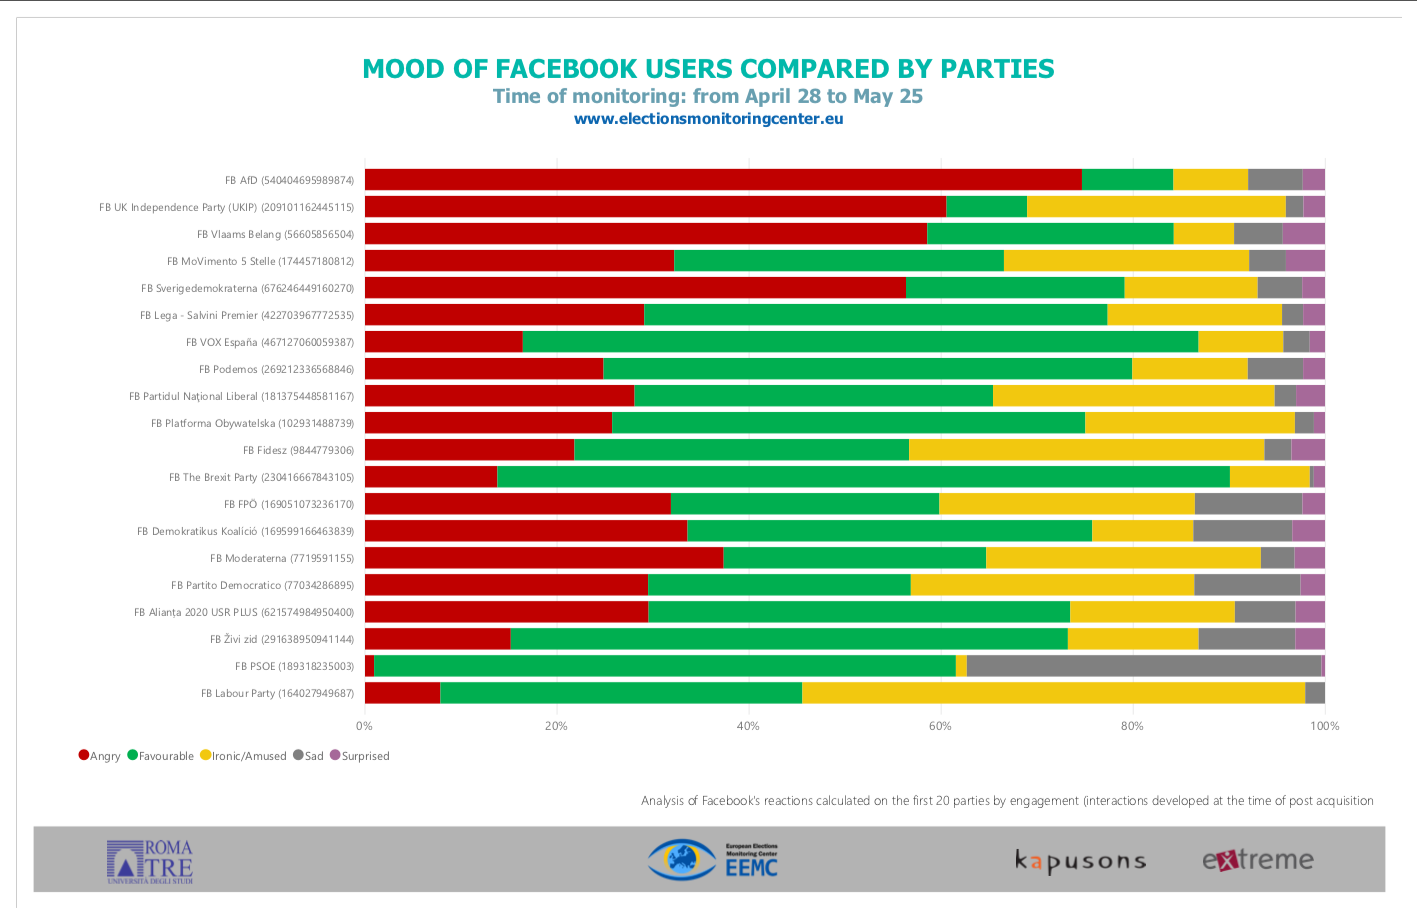
Chart n°8 - Facebook users' mood compared by parties
To download "Social Report n.2" in pdf format:
-
Related documents
-
EEmc report 2